ROI Calculator: How to Justify Investing in an Automated Coil Production Line
Jump to section
An automated coil production line pays for itself when its yearly gains beat its cost. Return on investment, or ROI, is the tool that proves this.
This guide helps buyers, such as plant owners, finance managers, and procurement teams, build a strong business case. It breaks down the costs, the returns, and the simple math behind ROI and payback. It also walks through a full example with clear numbers. The goal is to help a buyer justify an automated coil production line with honest figures, not guesswork.
What Does ROI Mean for a Coil Production Line?
ROI shows how much money a line returns compared with what it costs. It turns a large purchase into a simple percent. A positive ROI means the line earns back more than it costs. Two numbers matter most here, such as the ROI percent and the payback period. The ROI percent shows the size of the return. The payback period shows how fast that return arrives. Together, they tell a buyer whether the investment makes sense. ROI also lets a buyer compare the line with other choices, such as hiring more staff, keeping the cash in the bank, or buying a smaller machine. The option with the best return wins the budget.
Counting the Full Cost of an Automated Line
The true cost of a line is more than its sticker price. A fair ROI must include every expense, both one-time and ongoing. Buyers who skip a cost end up with a number that looks too good. The two parts below list the main costs to include.
One-Time Costs (Machine, Tooling, Shipping, and Install)
One-time costs are the money a buyer spends to get the line running. These costs include several items, such as the machine price, tooling and dies, shipping, and installation. Tooling can be a large line item, since each coil type may need its own die. Shipping matters too, because a full line is heavy and needs strong crating. Installation and commissioning add cost as well, but they make sure the line runs right from day one. Operator training is a one-time cost too, since staff must learn the new system before the line hits full output. A buyer should add all of these into the total investment.
Ongoing Costs (Energy, Maintenance, and Spare Parts)
Ongoing costs are the money a line uses each year to keep working. These costs cover items, such as energy, maintenance, spare parts, and operator wages. Energy powers the motors, presses, and controls. Maintenance keeps the line in good shape and prevents breakdowns. Spare parts, such as belts, dies, and sensors, wear out and need replacing. A buyer should track these yearly costs, since they lower the net gain used in the ROI math.
Where the Returns Come From
An automated line returns money in four main ways, such as lower labor, higher output, better quality, and more uptime. Each one adds to the yearly gain. The parts below explain each source so a buyer can put a number on it.
Lower Labor Costs
Automation cuts the number of operators a line needs. A manual line may need eight workers per shift. An automated line may need only three. The five saved workers lower payroll every year. For example, at a fully loaded cost of $15,000 per operator per year, five fewer workers save $75,000 a year. Lower labor cost is often the single largest gain from automation.
Higher Output and Throughput
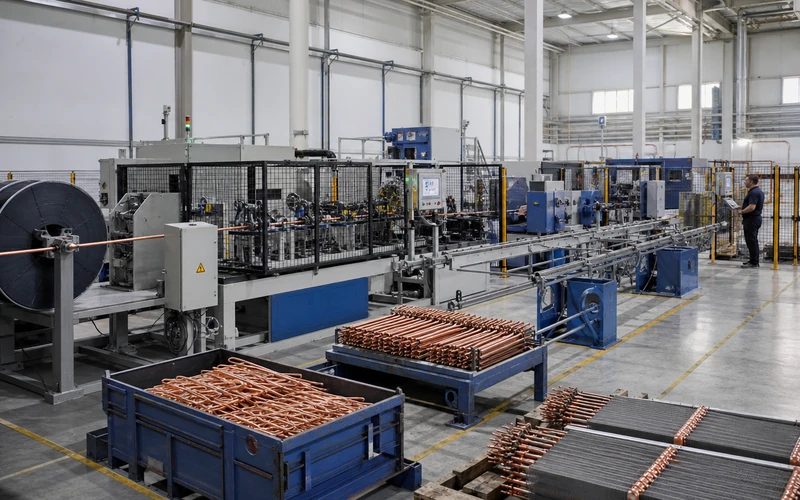
An automated line runs faster and longer than a manual one. It holds a steady pace across a full shift, while human speed drops over time. Higher throughput means more coils from the same hours. More coils bring more sales, which raises profit. A line that lifts output by 30 percent can turn away fewer orders and win larger contracts.
Better Quality and Less Scrap
Automation makes each coil the same, which cuts scrap and rework. A manual line may scrap 5 percent of its coils. An automated line with vision checks may scrap only 1.5 percent. Less scrap saves both material and labor. It also protects the buyer’s brand, since fewer bad coils reach the customer. Steady quality is a real gain, even though it is easy to overlook.
More Uptime and Fewer Delays
An automated line spends more time running and less time stopped. Features, such as auto-feeding, quick tool changes, and predictive maintenance, keep the line moving. A manual line may run at 80 percent uptime. An automated line may reach 92 percent. That extra uptime adds good output without any extra shifts. Fewer delays also help a plant hit its delivery dates.
How to Calculate ROI and Payback Period
Two simple formulas turn these numbers into a clear decision. One shows the size of the return. The other shows the speed. A buyer only needs a few basic figures to use them.
The ROI Formula
ROI compares net gain with cost. The formula is simple:
ROI (%) = (Net Gain ÷ Investment Cost) × 100
Net gain is the total money saved and earned over a set time, minus the investment. A higher percent means a better return. Most buyers measure ROI over three to five years.
The Payback Period Formula
Payback period shows how fast a line pays for itself. The formula is short:
Payback (years) = Total Investment ÷ Annual Net Gain
A shorter payback means less risk. Many plants aim for a payback of two to three years on this kind of line. A payback under two years is a strong result.
A Sample ROI Calculation (Worked Example)
A simple example shows how math works in practice. The case below compares a manual line with an automated coil line at the same plant. All figures are examples, so real numbers will differ by project.
The Numbers Side by Side
| Factor | Manual / Semi-Manual Line | Automated Coil Line |
| Operators per shift | 8 | 3 |
| Output (coils per shift) | 400 | 520 |
| Scrap rate | 5% | 1.5% |
| Uptime | 80% | 92% |
| One-time investment | — | $250,000 |
The automated line needs a $250,000 investment. This total includes the machine, tooling, shipping, and installation. The gains below all compare the automated line with the old manual one.
Working Out the ROI and Payback
The automated line creates four yearly gains, such as labor savings, scrap savings, added output profit, and energy savings. Here is the example breakdown:
- Labor savings: 5 fewer operators × $15,000 = $75,000 per year
- Scrap savings: less wasted material and rework = $20,000 per year
- Added output profit: higher throughput and uptime = $30,000 per year
- Energy savings: more efficient drives = $5,000 per year
- Total annual net gain = $130,000 per year
Now the buyer can run both formulas:
- Payback = $250,000 ÷ $130,000 = about 1.9 years
- Five-year ROI = ($650,000 − $250,000) ÷ $250,000 × 100 = 160%
In this example, the line pays for itself in under two years. After that, most of the yearly gain becomes profit. These results show why many plants view automation as a sound investment.
Factors That Change Your ROI
ROI is not fixed. A few key inputs move it up or down, such as volume, labor rates, prices, and utilization. A buyer should test each one with their own figures. The parts below explain how each factor works.
Production Volume
Volume has the biggest effect on ROI. A high-volume plant spreads the fixed cost over many coils, which shortens payback. A low-volume plant takes longer to earn the money back. Buyers with steady, large orders gain the most from automation.
Local Labor Rates
Labor rates change the size of the labor savings. In regions with high wages, cutting five operators saves a lot, so ROI rises fast. In regions with low wages, the labor gain is smaller. Buyers should use their own real wage costs in the math.
Material and Energy Prices
Material and energy prices shape the scrap and energy gains. When metals, such as copper and aluminum, cost more, lower scrap saves more money. When power is costly, an efficient line saves more too. Rising prices often make automation look even better over time.
Line Utilization
Utilization is the share of time a line actually runs. A line used across two or three shifts earns its keep faster than one used for a few hours a day. Higher utilization spreads the cost and lifts ROI. Buyers should plan enough work to keep the line busy.
Financing and Tax Effects
Financing and tax rules can change the real ROI. A buyer who pays with a loan spreads the cost over years, which eases cash flow but adds interest. Many regions also let a plant deduct equipment depreciation, which lowers the yearly tax bill. These effects do not change the machine, but they change the money. A buyer should ask an accountant to include them in the final ROI figure.
Benefits That Are Hard to Put in Numbers
Some gains do not show up in a simple ROI, yet they still add real value. These benefits include several items, such as worker safety, steady quality, and room to grow. A manual line puts workers near presses and sharp tubes, while automation moves them away from risk. Steady quality builds a strong name that wins repeat orders. A scalable line also lets a plant take on bigger contracts without a full rebuild. Automation even produces data that helps managers plan and improve. These soft gains often tip a close decision toward automation.
Frequently Asked Questions
How long is the payback period for an automated coil line?
Payback depends on volume, labor cost, and price. Many plants see payback in two to three years. High-volume plants with high wages often reach it in under two years. A buyer should run the numbers with their own figures to get a true answer.
Is automation worth it for a small or mid-size plant?
Often, yes. Even a mid-size plant can gain from lower labor, less scrap, and steady quality. Buyers with limited volume can start with a smaller or modular line. This step keeps the cost lower while still capturing the key gains.
What counts as a good ROI for a production line?
A good ROI beats the return from other uses of the same money. Many buyers look for a payback under three years and a five-year ROI above 100 percent. The example above, at 160 percent over five years, would count as a strong result.
How can a buyer lower the risk of a bad investment?
A buyer lowers risk by using honest numbers and a proven supplier. Real wage, scrap, and volume figures keep the ROI true. A factory acceptance test and strong after-sales support protect the buyer after the sale. Careful planning turns a big purchase into a safe one.
Conclusion: Building the Business Case for Automation
A strong business case rests on clear math and honest inputs. When a buyer counts the full cost, adds the real gains, and runs the ROI and payback formulas, the answer becomes plain. In the example above, an automated coil production line paid for itself in under two years and returned 160 percent over five. Most plants with steady volume can expect a similar story. To see the machines behind these gains, buyers can explore the integrated tube processing line range or share their own numbers with the team through the contact page for a tailored ROI estimate.
Want to Know More About Our Products?
View All Products Now